These Meticulous Setlist Graphs Reveal Career-Spanning Song Selections of Bob Dylan, David Bowie, The Rolling Stones, Tom Petty and More
 Marc Millman
With New Year’s Eve runs kicking off last night and tonight, what better time to geek out about setlists? Whether you’re trying to figure out which of Phish’s Gamehendge songs you haven’t caught live yet or reliving that time you saw Dylan back when he played his hits, poring over setlists is a part of the live music lover’s existence, and these infographics from The Economist are a great way to take a look at the big-picture performance career arcs of some of your favorite artists.
The graphs show, in bubble form, the song selection throughout the careers of a number of bands and solo artists, grouped by decade and album. Here’s an example from Bob Dylan:
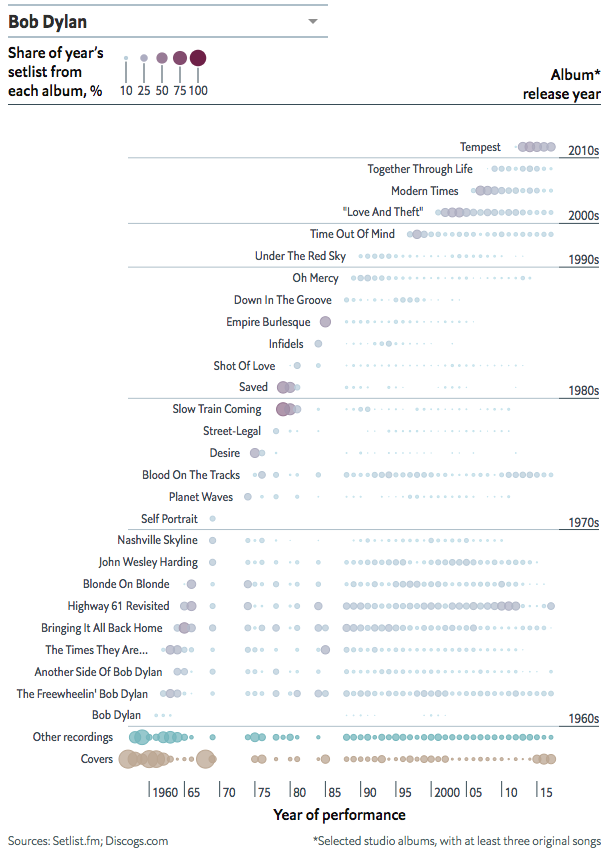
As you can see, Dylan began his career relying heavily on covers (the brown bubbles at the bottom of the chart), and with each record cycle, those album’s tracks were played for a time then possibly discarded. Dylan has kept up with much of his ’60s material until more recently, especially in the case of 1965’s Highway 61 Revisited. ’80s Dylan was mostly swept under the rug after the decade was over, and ’70s Dylan is mostly represented in later years by 1975’s Blood on the Tracks as the legendary songwriter tends to lean on his newer works (and a resurgence of covers) in the last few years.
Other artists detailed in The Economist‘s chart selection, which was created from information gathered from setlist.fm and discogs.com, include The Beatles (which moves into Paul McCartney’s solo offerings), Led Zeppelin (which does the same with Robert Plant), Pink Floyd (Roger Waters), The Rolling Stones, Prince, Tom Petty, Bruce Springsteen, David Bowie, Elvis Presley, The Clash, Ray Charles and more, all the way up to Beyoncé, Kanye West and Taylor Swift.
Check out all the setlist nerdiness here.


")
")
")